To preview a chart of the test's moisture-density curve, select Window > Chart or click on the Chart navigation tab.
Click on one of the topics below to jump directly to a help section:
- The Chart Review window will display both an oversize-corrected and an uncorrected curve if A) The test data includes oversize information (e.g., % oversize, bulk specific gravity, etc.), B) The specification used by the test includes an oversize correction applied to each test point instead of applying the correction only to the maximum dry density and optimum moisture values, and C) The test's specification uses the Report the uncorrected curve in addition to the corrected curve option.
Otherwise, a single curve will be displayed.
Toolbar Controls
The toolbar at the top of the curve preview window contains the following controls:
Plot:
Determines whether the program plots the curve and test points, the curve only, or the test points only. See this section for further details.
Data-averaging curve
Selecting this option produces a smoother curve, but one that doesn't necessarily pass directly through every test point. Refer to this section for further details.
Similar Curves
Clicking this button causes the program to display moisture-density curves from the same project that have maximum dry density/optimum moisture contents close to the current test's maximum dry density and optimum moisture.
- The button is disabled for one-point tests because the program always shows the similar curves for these tests.
"+" and "-" buttons
Clicking on the "-" button increases the moisture and density scale steps (i.e., the chart is zoomed out), while the "+" button decreases the scale steps (i.e., the chart is zoomed in).
Reshaping the Curve
You can change the shape of the compaction curve by adding shaping points (additional curve points added merely to force the curve to pass through a particular moisture/density location), moving test points or by choosing to omit test points generated from bad data, as shown in the following examples:
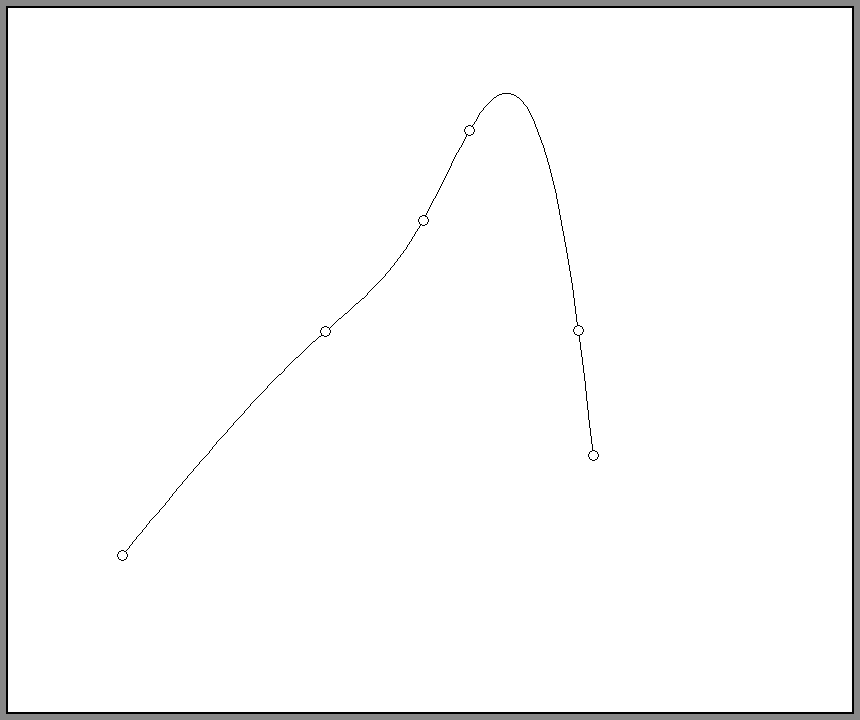
Original Moisture-Density Curve
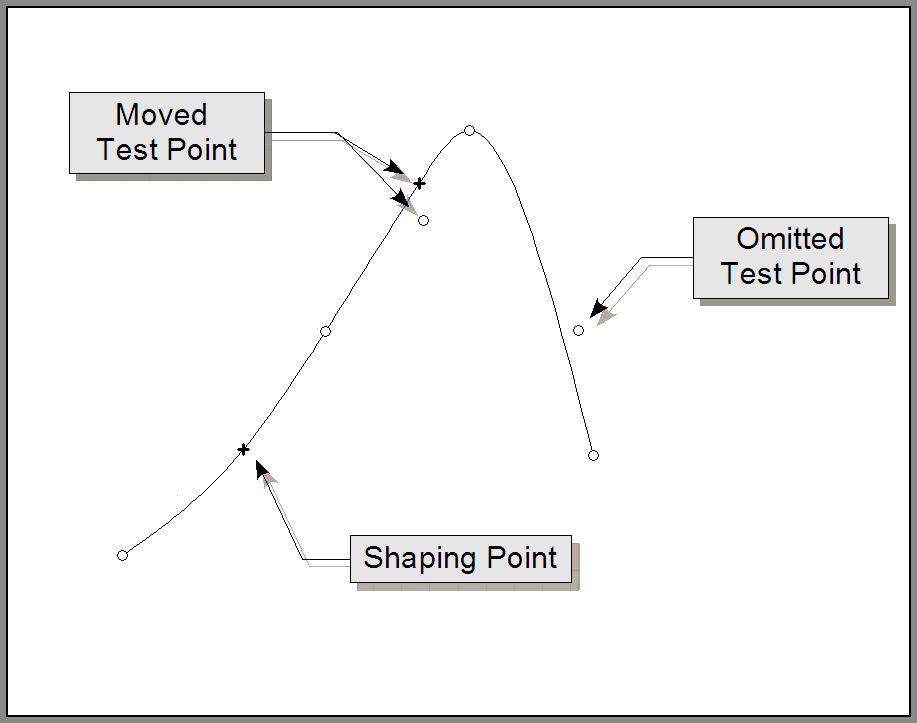
Same Test Data; Added Shaping Point and Moved and Omitted Data Points
To reshape the curve by adding a shaping point:
The shape of the curve may be adjusted by forcing it to pass through a new point. To do this, select Curve then either Shape Curve (if the window shows a single curve) or Shape Corrected Curve or Shape Uncorrected Curve. Next, move the mouse cursor to the location desired for the curve to pass through, then click the left mouse button. The new point will be marked with a "+", which will not be shown on charts included on hardcopy reports.
To remove a shaping point:
Move the mouse cursor over the shaping point, then click the right mouse button and select Delete this Point from the popup menu.
You can also remove all shaping points by selecting Curve > Delete All Shaping Points.
To move a shaping point:
Once you've placed a shaping point you can move it: Place the mouse cursor over the shaping point, click the right mouse button and select Move this Point. Move the mouse cursor to the desired position for the shaping point then click the left mouse button.
- Shaping points cannot be added to data-averaged curves.
You can also reshape the curve by moving or hiding test points:
Move the cursor over the test point then click the right mouse button and select Move this Point, then move the mouse cursor to the desired position for the test point then click the left mouse button.
- Note that the test point itself will continue to be shown in its original position, although the compaction curve will no longer pass through it. If you do not want to have the test point shown on the chart, use the procedure covered below.
To omit a test point from the chart:
Sometimes it may be necessary to remove a test point from the compaction chart because the testing data for the point is obviously not correct. To remove the point from the chart, move the mouse cursor over the bad point, right-click and select Include this Point on Curve to uncheck the option. (The point will still show up on the chart review window and on data summary reports, but it will not appear on chart reports.)
If the test point's data appears to have been entered incorrectly, the data can be corrected by moving the mouse cursor over the test point, then right-clicking and selecting Edit this Point's Data.
Changing How the Curve is Displayed
LabSuite includes several options for changing how the compaction curve is plotted:
You can omit the curve from chart reports:
If your compaction curve cannot be modified into an acceptable shape you can choose to have LabSuite plot just the test points, omitting the curve. (You can then draw the curve by hand on the hardcopy report.) To omit the curve, select Curve > Plot Test Points Only. Note that this option also causes the calculated maximum dry density and optimum moisture values to be omitted from the report (you'll need to work out your own values based upon the curve you've hand-drawn).
You can omit the test points from chart reports:
Selecting Curve > Plot Curve Only omits the test points from the chart, leaving only the curve.
The compaction curve can be plotted using a data-averaging curve model:
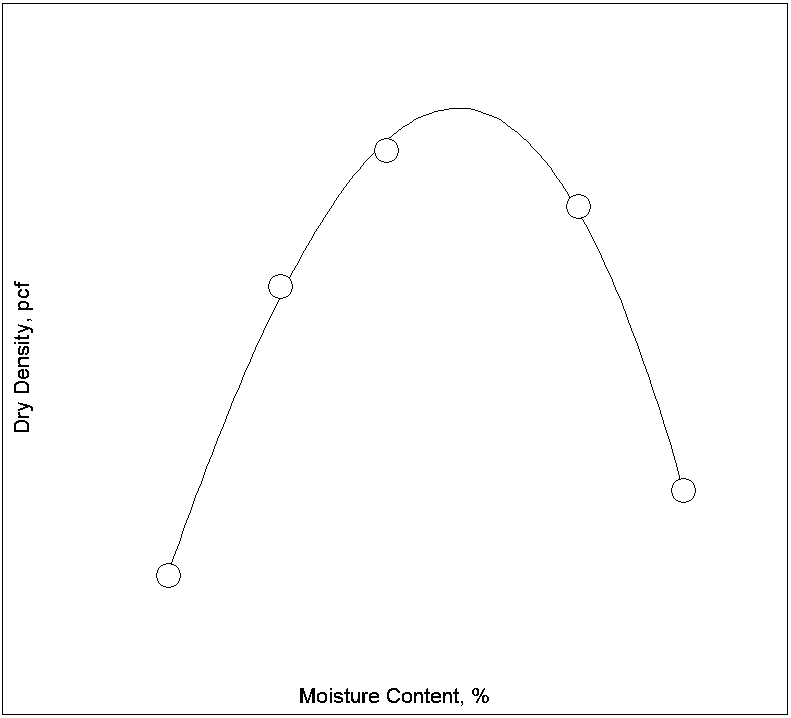
If your test data doesn't form a smooth compaction curve, Curve > Data-Averaging Curve can be used to draw a compaction curve formed using a least-squares linear regression mathematical model. In simplified terms, these curves average the distance between the curve and each test point, making for a smoother curve, but one that may not actually pass directly through each test point. As an example, the following figure shows a compaction curve that's somewhat oddly-shaped because the points on the wet side of the curve do not make a smooth curve:

Moisture-Density Curve Drawn Using the Default Curve Plotting Method
Selecting the Data-Averaging Curve option produces a smoother curve shape:
Moisture-Density Curve Drawn Using the Data Averaging Method
Note that the second curve does not exactly pass through each test point: For the top two points on the wet side of optimum moisture, the curve essentially "splits the difference" between the two points by passing on the right side of one and on the left side of the second. The resulting curve appears smoother.
- The data-averaging curve model is not a panacea for cleaning up all misshapen curves. Some curves may benefit more by moving test points, removing bad data points from the curve, or by adding curve shaping points. Additionally, curves with five or six test points do not tend to plot very well using the data-averaging approach.
Creating Curves for One-Point Tests
LabSuite supports a simplified version of the AASHTO Family of Curves test method (T 272). The program may be used to match up the single test point of a one-point compaction test against the closest already-entered compaction curves above and below the point: a new curve passing through the single test point is synthesized from a combination of the two existing curves.
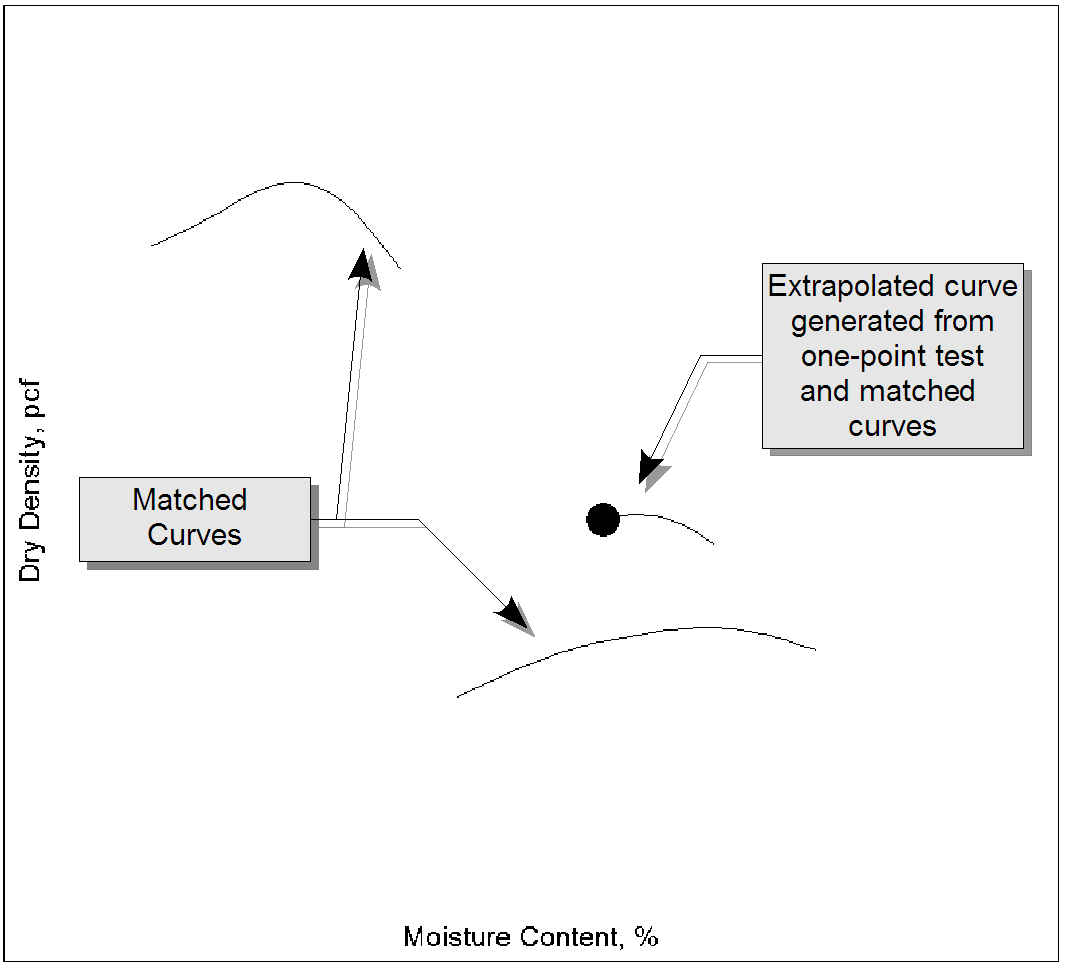
One-Point Test with Extrapolated and Matching Curves
LabSuite's one-point curve generation differs from the AASHTO standard in that the program only takes into account one curve above and one curve below the test point, while the standard requires that the behavior of an entire family of curves be accounted for when extrapolating the new curve.
To create a curve for a one-point test, begin by entering the data for the single test point, then select Window > Chart. When the Chart Review window is displayed, a pane will be added to the left-hand side listing compaction curves above and below the test point.
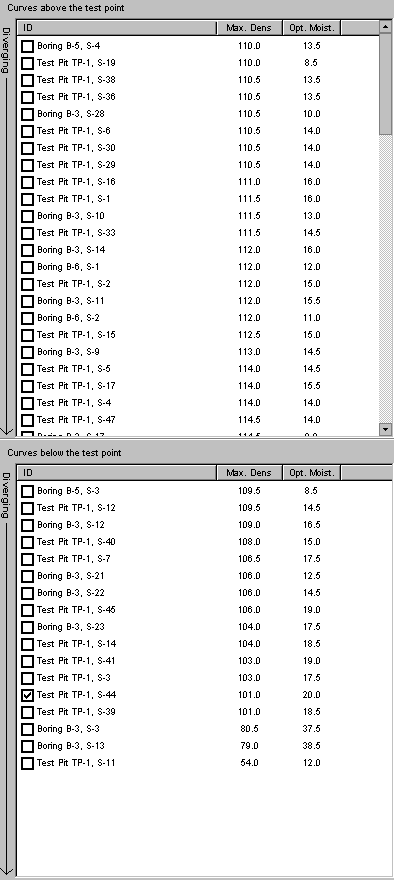
One-Point Match Curves Pane
- Curves are ordered in the list by how close they are to the single test point.
The pane includes two lists of curves: one list contains curves that fall above the one-point test and the other list contains curves that fall below the one-point test. Clicking on the checkbox for one curve from each list causes the program to synthesize a curve passing through the test point and roughly matching two match curves.
- The synthesized curve can be erased by unchecking the curve selections in the Curves above the test point and Curves below the test point boxes.
- If oversize moisture or density corrections are applied, the test specifications used by both the match curves and the one-point test curves should use identical settings for the Correct correction application test specification setting.