LabSuite features three methods for reporting your data:
XML files contain a listing of both your raw testing data (such as the weights retained on each sieve during a grain size sieve test), as well as various values calculated by the software such as D10, Cu, etc. XML files are saved on-disk and may be viewed by a web browser or by Microsoft Excel. This is an ideal format for e-mailing testing data and results to your clients in a format that incorporates both a means of presentation (through a web browser) as well as a means of manipulating the raw data (through a spreadsheet).
- XML files are generated by selecting Test > Export XML File.
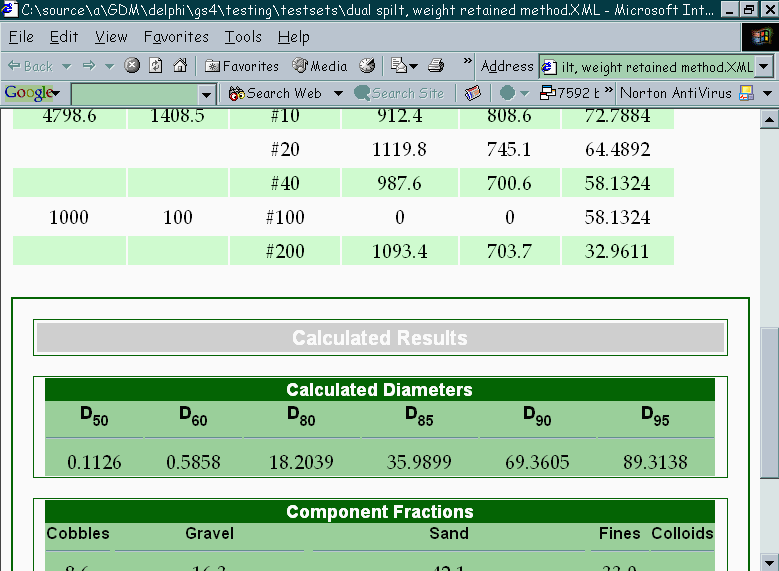
Portion of an XML Report Viewed in Internet Explorer
Summary reports list the raw data taken from your test. They may be sent to a printer or saved on disk.
- Data summary reports are generated by selecting Test > Output Data Summary Report.
Chart reports are more formalized than summary reports: for example, a grain size chart report typically includes, in addition to a chart of particle size vs. percentage, a block listing your company name, along with tables listing various calculated percentages and other values. Unlike summary reports, chart reports do not list raw testing data such as the weight retained on each sieve.
- Another difference between chart and summary reports is that LabSuite ships with several different chart reports from which you can select, while there's only one format for the summary report.
- Chart reports are generated by selecting Test > Output Chart Report.
- Chart and summary reports can be saved to a file in .PDF, .EMF, .PNG or .DXF format.
- Through the Windows clipboard, you can also export chart reports to programs that can paste pictures into their documents (such as word processors or paint programs). To do this, select Edit > Copy Entire Test: once on the Windows clipboard, you can paste the chart into, for example, a word processing document by starting the word processor and selecting Edit > Paste.