CONS features three methods for reporting your data:
XML files contain a listing of both your raw testing data as well as various values calculated by the software such as Cc, Cr, etc. XML files are saved on-disk and may be viewed by a web browser or by versions of Microsoft Excel. This is an ideal format for e-mailing testing data and results to your clients in a format that incorporates both a means of presentation (through a web browser) as well as a means of manipulating the raw data (through a spreadsheet).
- XML files are generated by selecting Test > Export XML File.
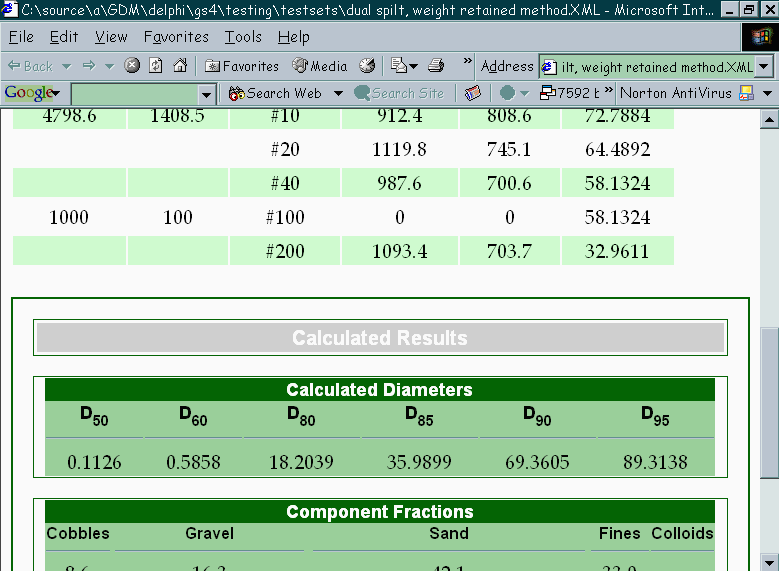
Portion of an XML Report Viewed in Internet Explorer
Summary reports list the raw data taken from your test. They may be sent to a printer or saved on disk.
- Data summary reports are generated by selecting Test > Output Data Summary Report.
CONS chart reports differ from data summary reports in that the former prominently features charts (compression, Cv vs. log10(pressure) and time-rate), while data summary reports feature raw testing data (with small optional time-rate charts). CONS has two general types of chart reports: the compression report, which, in addition to a chart of void ratio/deformation/% strain vs. log10(pressure) can also optionally include a table of Cv values or a chart of Cv vs. log10(pressure), and the time-rate report, which includes charts of dial reading vs. log10(time) or √time.
- Another difference between chart and summary reports is that CONS ships with several different chart reports from which you can select, while there's only one format for the summary report.
- Chart reports are generated by selecting Test > Output Chart Report.
- Chart and summary reports can be saved to a file in .PDF, .EMF, .PNG or .DXF format.
- Through the Windows clipboard, you can also export chart reports to programs that can paste pictures into their documents (such as word processors or paint programs). To do this, select Edit > Copy Entire Test: once on the Windows clipboard, you can paste the chart into, for example, a word processing document by starting the word processor and selecting Edit > Paste.