Selecting Options > Program Setup and clicking on Chart Reports underneath Moisture-Density in the navigation list at the dialog's left side allows you to modify the appearance of reports produced for moisture-density tests:
The chart report title is a single line of text shown at the top of the moisture-density chart report. Typically the title reads, e.g., Compaction Test Report or Moisture-Density Test Results.
Determines the width of the moisture-density curve when drawn on a moisture-density chart report.
Denote point of max. dens./opt. moist. on charts
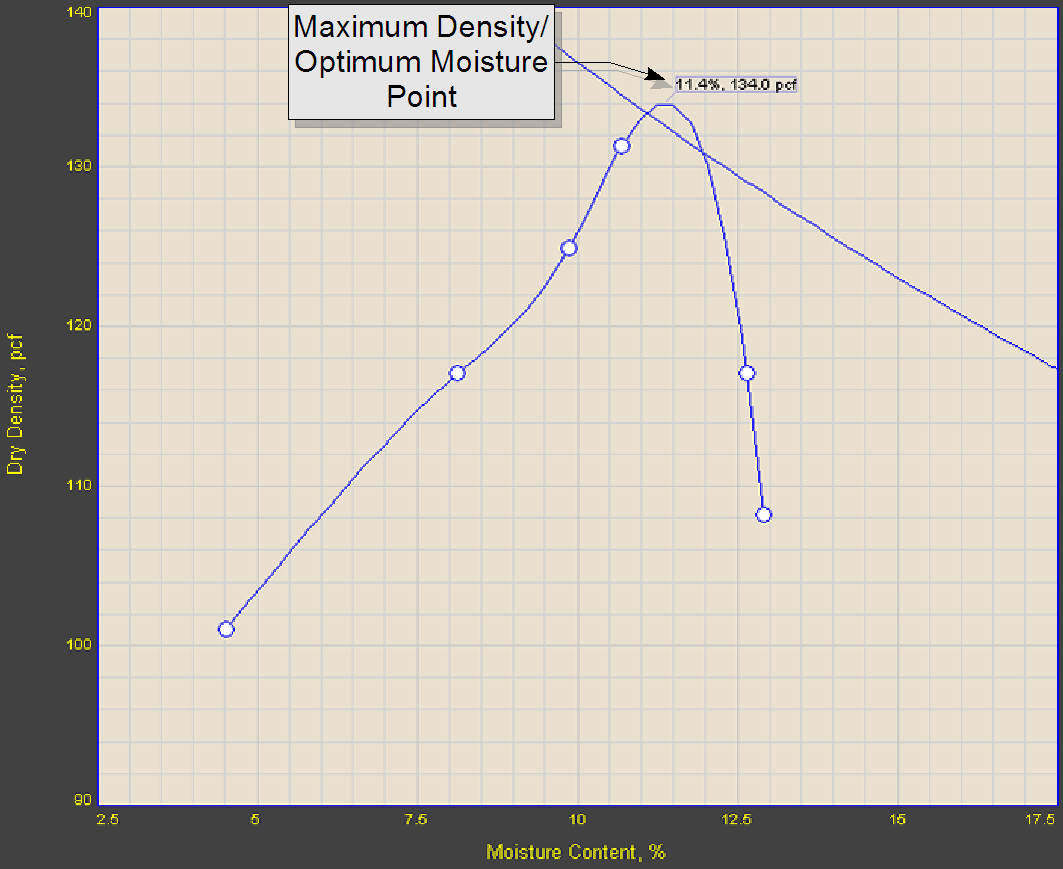
Selecting this option adds a small call-out box to the moisture-density chart pointing to the point of maximum density/optimum moisture. The selection is required by many test standards (e.g., ASTM D698).

Moisture-Density Chart with Call-Out Box
Draw extrapolated one-point curves on chart reports
Draw one-point test match curves on chart reports
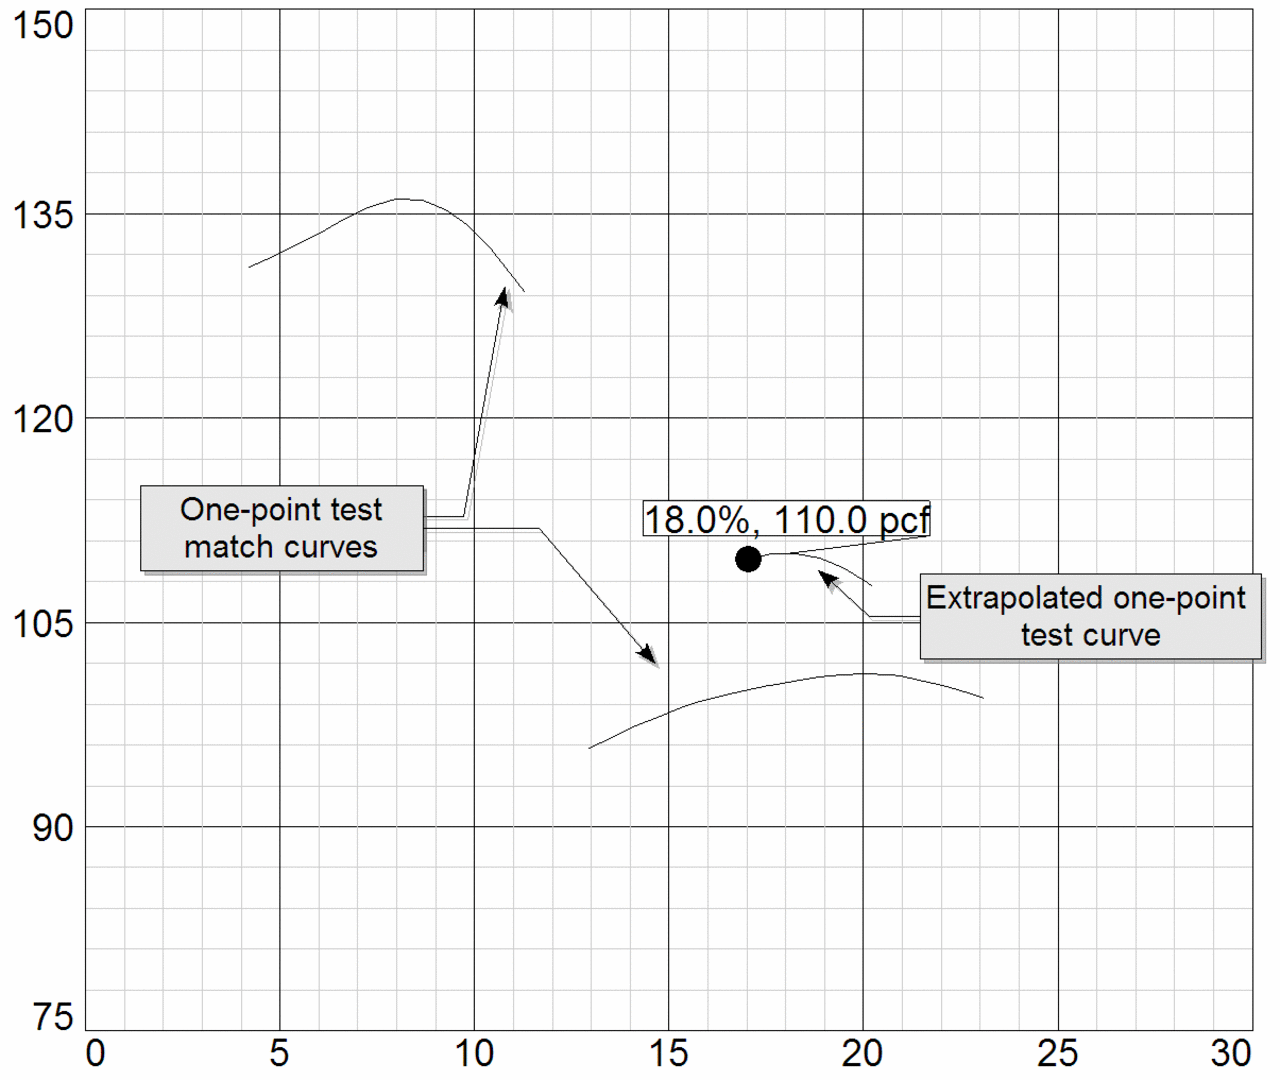
LabSuite supports a simplified version of the AASHTO T 272 one-point test matching procedure that extrapolates a one-point test's compaction curve from a pair of existing tests' compaction curves. For one-point tests that have an extrapolated compaction curve, LabSuite can be configured to plot the extrapolated compaction curve (by checking the Draw extrapolated one-point curves on chart reports box) and/or the pair of existing tests' compaction curves (by checking the Draw one-point test match curves on chart reports box).

Synthesized One-Point Test Curve and Match Curves